Update 3/May/2017: The steps mentioned in this post need to be slightly changed with the updates in Keras v2.*. Please check the updated guide here: Visualizing Keras Models - Updated.
Have you ever wanted to visualize the structure of a Keras model? When you have a complex model, sometimes it's easy to wrap your head around it if you can see a visual representation of it. What if there's a way to automatically build such a visual representation of a model?
Well, there is a way. Keras has a model visualization function, that can plot out the structure of a model. It would look something like this,
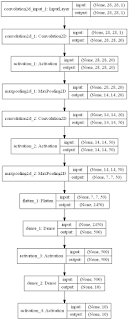 |
| The visualization of the LeNet model |
Above is the visualization of the LeNet model, which is defined in code as follows,
 # initialize the model
 model = Sequential()

 # first set of CONV => RELU => POOL
 model.add(Convolution2D(20, 5, 5, border_mode="same",
     input_shape=(height, width, depth)))
 model.add(Activation("relu"))
 model.add(MaxPooling2D(pool_size=(2, 2), strides=(2, 2)))

 # second set of CONV => RELU => POOL
 model.add(Convolution2D(50, 5, 5, border_mode="same"))
 model.add(Activation("relu"))
 model.add(MaxPooling2D(pool_size=(2, 2), strides=(2, 2)))

 # set of FC => RELU layers
 model.add(Flatten())
 model.add(Dense(500))
 model.add(Activation("relu"))

 # softmax classifier
 model.add(Dense(classes))
 model.add(Activation("softmax"))